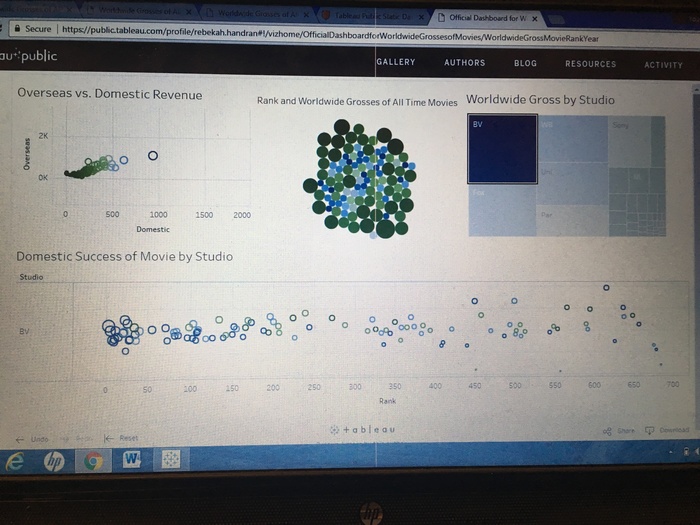
Tableau Public Interactive Dashboard Showing Buena Vista Studios Selected
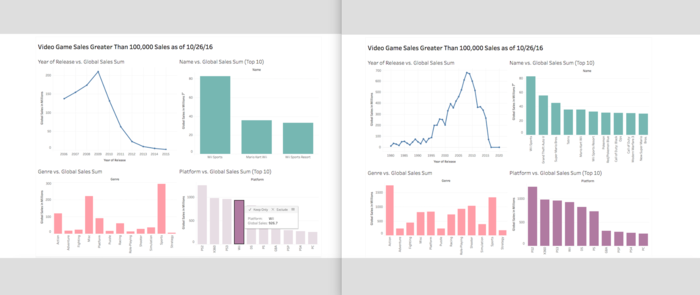
Interactive Dashboard: Video Game Sales Greater Than 100,000. Selecting a year, name, genre, or platform will show associated data. (left w/ interaction, right w/o interaction)
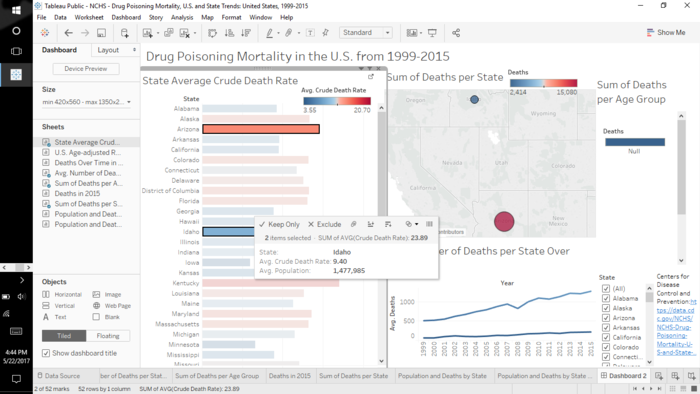
Interactive Dashboard for U.S. Drug Mortality
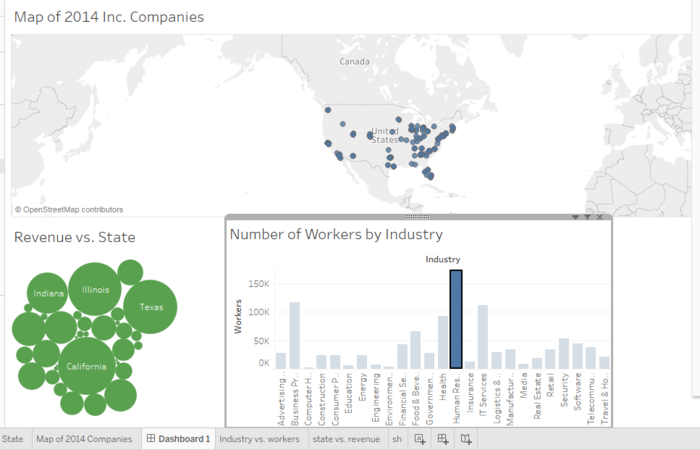
Interactive Dashboard showing revenue by state, map of all 2014 Inc. 5000 companies, and number of workers by industry, filtered to display human resource workers across all visualizations
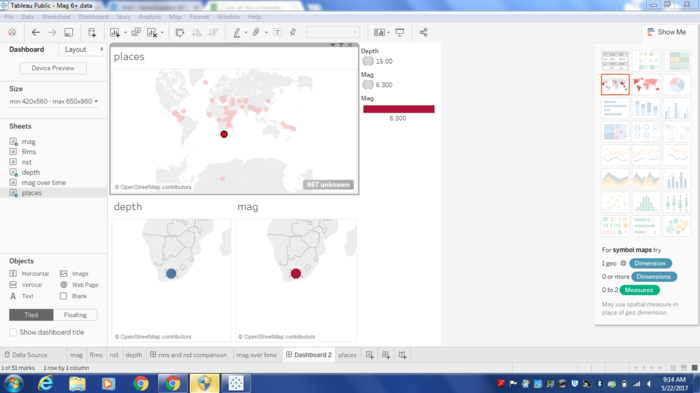
selecting one place highlights the depth and mag of the earthquake in that area.
College Scorecard Data for California Colleges and Universities.

 jannahmaling
Over 8 years ago
jannahmaling
Over 8 years ago
 ritu-mathews1
Over 8 years ago
ritu-mathews1
Over 8 years ago
 keren-godwin
Over 8 years ago
keren-godwin
Over 8 years ago