Sign up
Sign in
tableau
/
Data-Visualization-Interactive-Dashboard
/
u
/
MarkRapiz
/
Post #1
Mark Christopher Rapiz
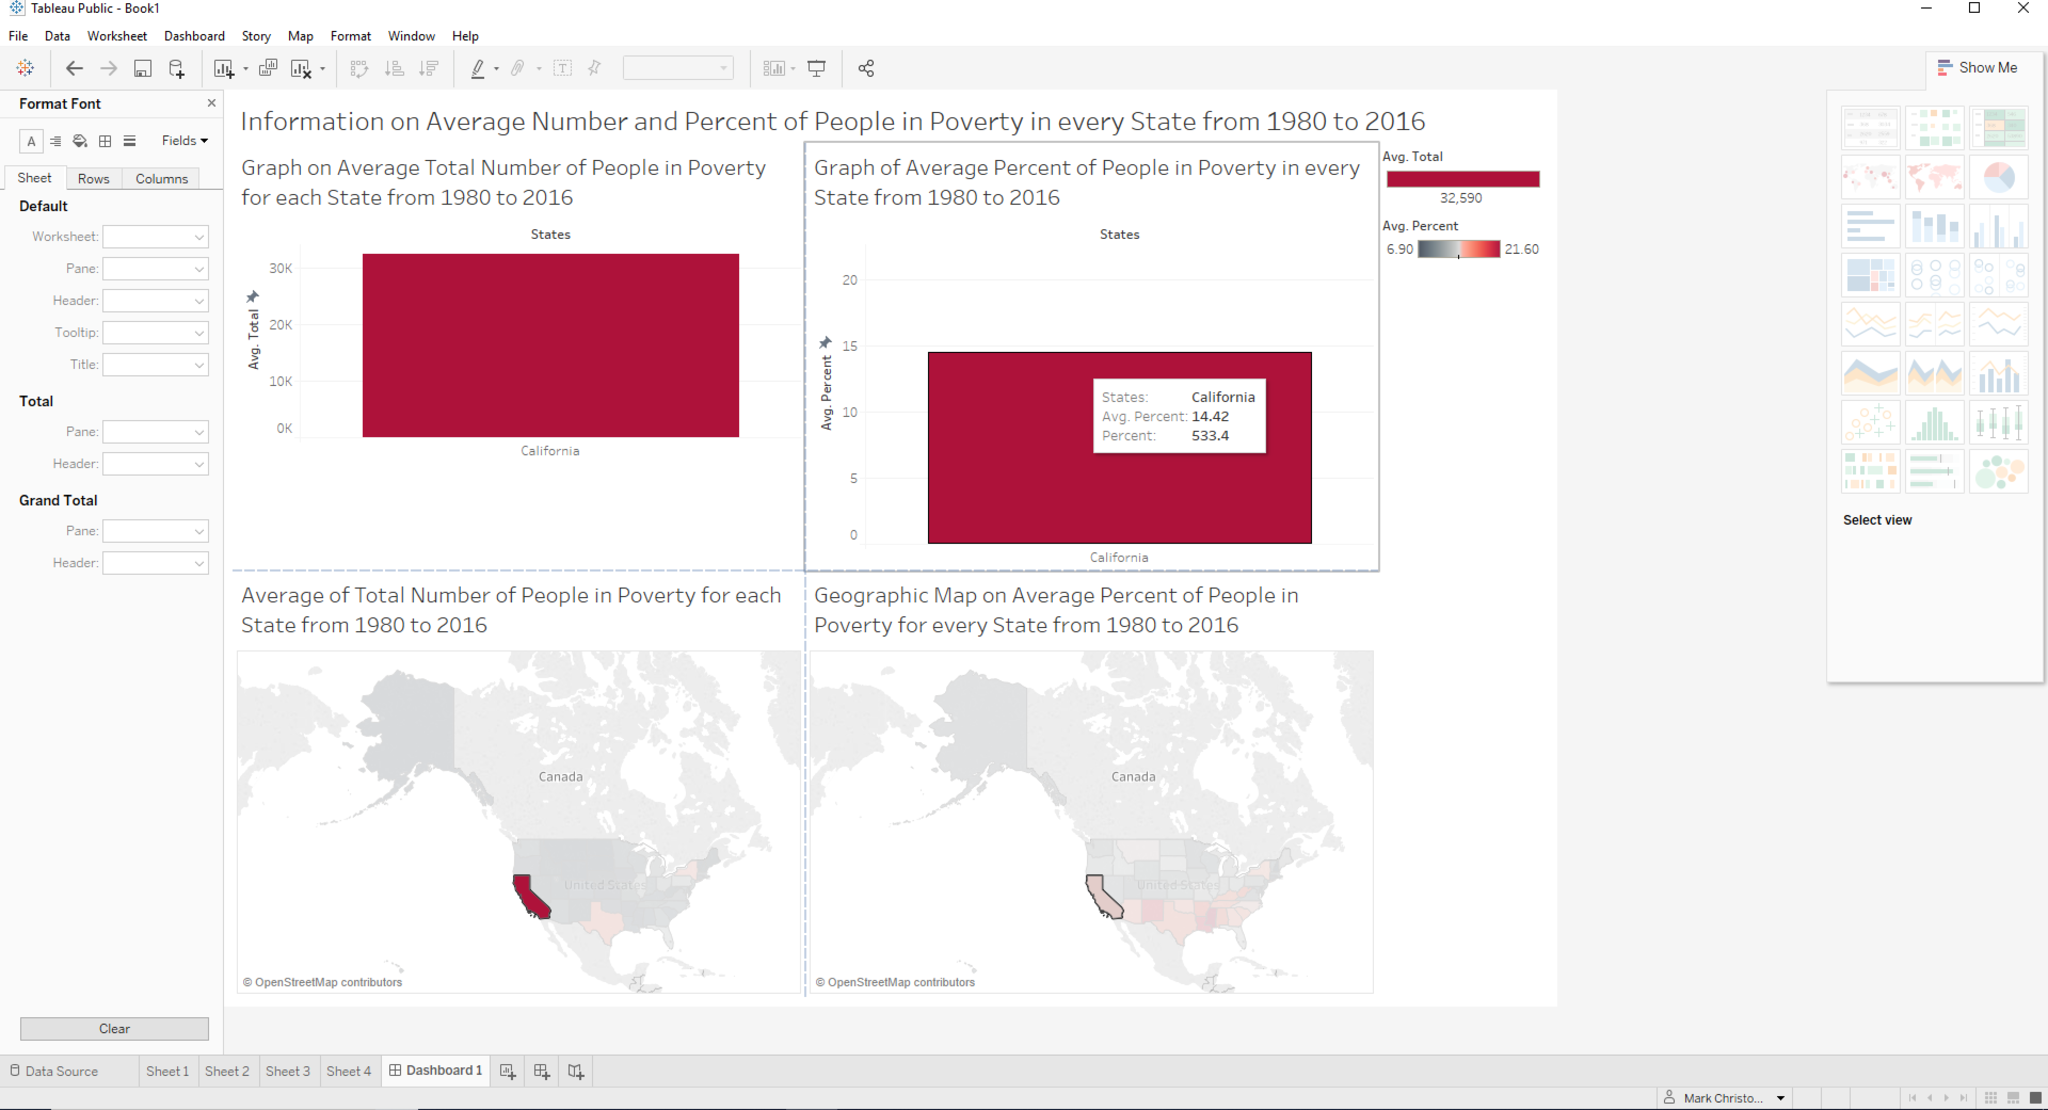
Tableau Public Interactive Dashboard
Interactive dashboard will filter a state's data when clicked on a state on the map. Clicking on a state in the average percent of people in poverty will show the data of the state on the poverty percent graph.
May 25, 2018 at 11:20 PM
Last updated over 7 years ago
Visible to public
×
Insert an image
Image URL
Upload an image
Use
PostImage.org
to upload the image
Copy the
Direct Link
to your clipboard and paste it into the box above
Heading
Section
New version available
Refresh
Dismiss

 Mark Christopher Rapiz