Sign up
Sign in
tableau
/
Data-Visualization-Interactive-Dashboard
/
u
/
Joel-Manesh
/
Post #1
Joel Manesh
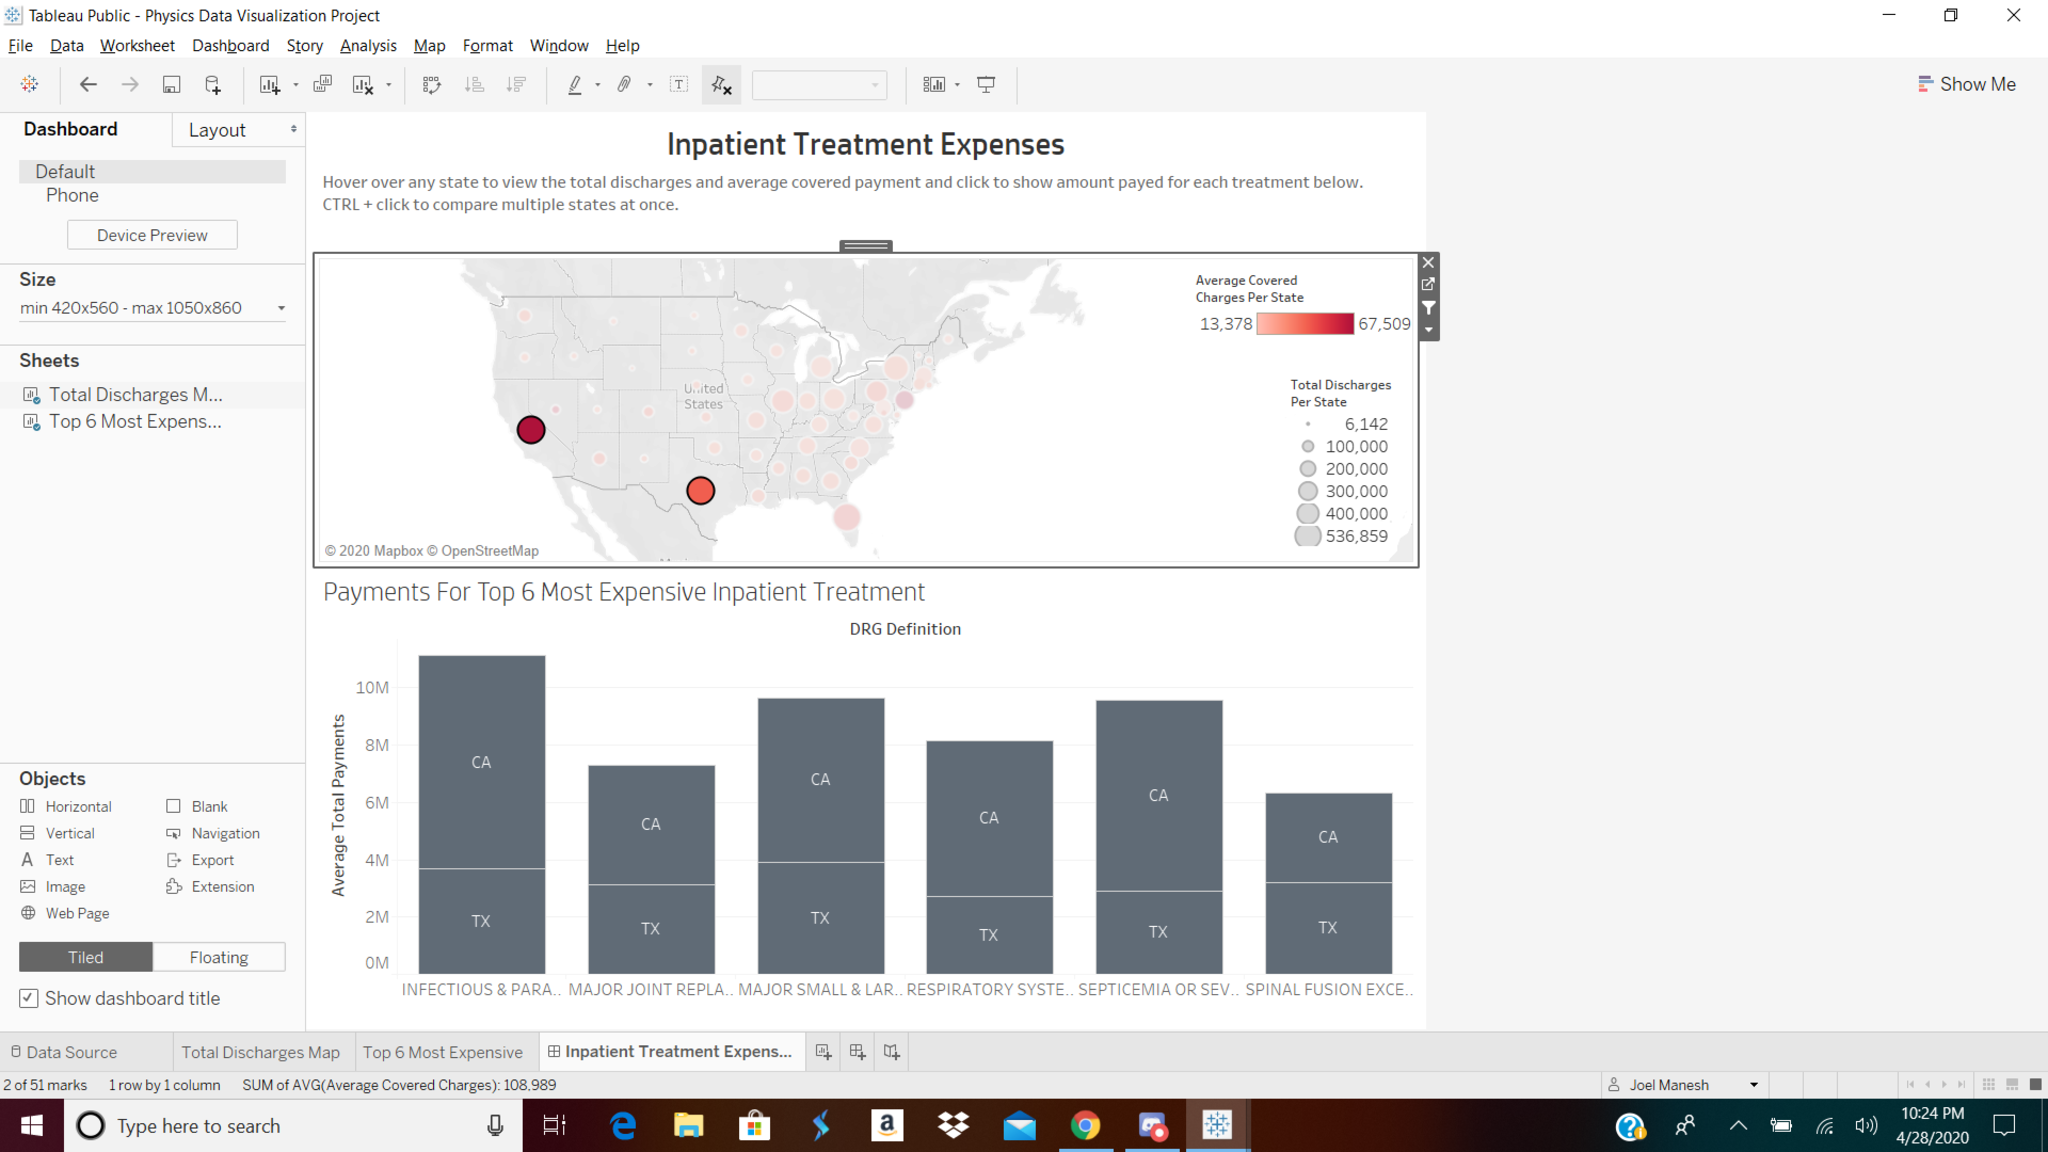
Tableau Public Interactive Dashboard
Clicking on one of the states isolates it in the chart below and shows the cost spent on each of the six treatments. Holding CTRL and clicking on other states makes it easy to compare multiple states
April 28, 2020 at 10:25 PM
Last updated almost 6 years ago
Visible to public
×
Insert an image
Image URL
Upload an image
Use
PostImage.org
to upload the image
Copy the
Direct Link
to your clipboard and paste it into the box above
Heading
Section
New version available
Refresh
Dismiss

 Joel Manesh